For real estate syndicates, private equity institutional investors, portfolio managers, and residential home buyers operating within Southwest Ohio, localized data is the ultimate anchor for strategic risk mitigation and capital deployment. Montgomery County, anchored by the industrial, logistical, and technological node of Dayton, presents an incredibly diverse and complex property landscape. Real estate valuation metrics, community growth vectors, household income distributions, and localized tax structures fluctuate heavily across municipal boundaries, making raw county wide averages virtually useless for deep due diligence. The primary structural driver behind these sharp geographic pricing and expenditure differences is the localized millage framework approved and enforced by individual public school systems. Because property taxes directly fund local education systems under Ohio legislative law, neighboring zip codes and sometimes even adjacent blocks within the same city can exhibit drastically different effective tax rates. Understanding these hyper local variations requires an exhaustive, property by property spatial and financial audit before acquiring assets. This definitive manual provides an exhaustive, multi dimensional breakdown of Montgomery County Ohio property demographics, establishes a clear index matching all Montgomery County property tax zip codes with their respective school systems, profiles the core investment cities, and delivers the official real estate forecast for the 2026 and 2027 fiscal cycles.
The Operational Mechanics of Local Property Tax Structures in Ohio
To effectively analyze property demographics in Montgomery County, a real estate professional must first understand the mathematical and legal framework governing how local property tax assessments interact with jurisdictional lines. In the state of Ohio, real estate taxes are calculated using a unit of measurement known as “mills.” One mill represents one dollar of tax liability for every one thousand dollars of assessed property valuation.
However, looking at the raw millage rate alone can be highly deceptive due to two unique mechanisms in Ohio tax law. The distinction between appraised value and assessed value, and the application of tax reduction factors under Ohio House Bill 920.
Appraised Value vs Assessed Value
In Ohio, property taxes are not applied to 100% of a home’s fair market value. Instead, they are calculated against an “Assessed Value,” which is statutorily set at exactly 35% of the property’s total appraised market value. For example, if the Montgomery County Auditor appraises a suburban home in Centerville at $300,000, the taxable baseline used for all millage calculations is exactly $105,000.
The Impact of House Bill 920 on Effective Rates
Passed in 1976, House Bill 920 is a piece of legislation that protects property owners from automatic tax increases caused by inflation or rapid market appreciation. When property values rise throughout a school district or township during a county reappraisal, HB 920 automatically scales down the voted millage rates so that the tax levies generate the exact same fixed dollar amount for the school or municipality as originally approved by voters.
Consequently, every jurisdiction has a “Gross Millage Rate” (the original voted rate) and an “Effective Millage Rate” (the actual rate applied after HB 920 reductions). This is why tracking the dynamic effective tax rate across individual zip codes is vital for predicting your monthly mortgage escrow requirements as properties in rapidly appreciating neighborhoods often see their effective tax percentages adjust differently than those in stagnant zones.
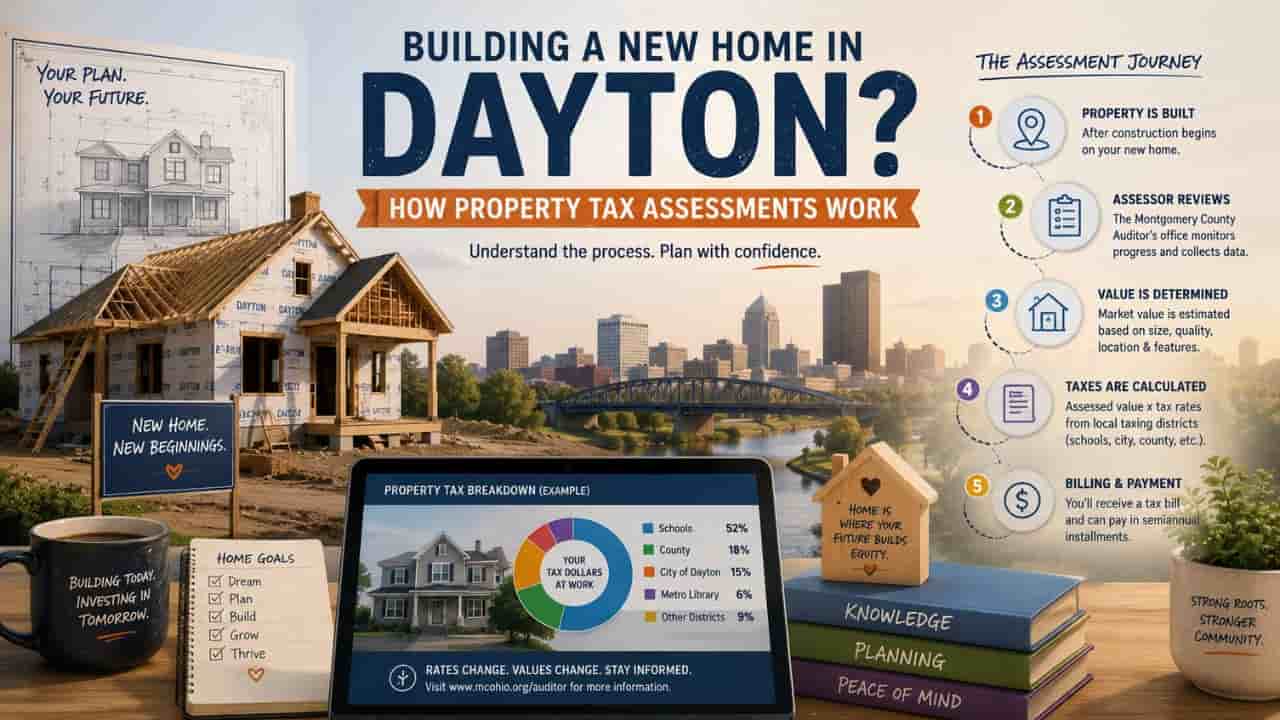
The Triennial Update and Sexennial Reappraisal Cycle
Because the Montgomery County Auditor is legally required to execute a comprehensive, property by property physical “Sexennial Reappraisal” every six years, alongside a statistical “Triennial Update” at the three year midpoint, local property demographics are constantly shifting. These adjustments directly impact net operating income (NOI) for landlords and change the overall affordability index for local home buyers, making real time zip code monitoring an essential baseline for portfolio protection.
Comprehensive Zip Code, City, and School District Tax Matrix
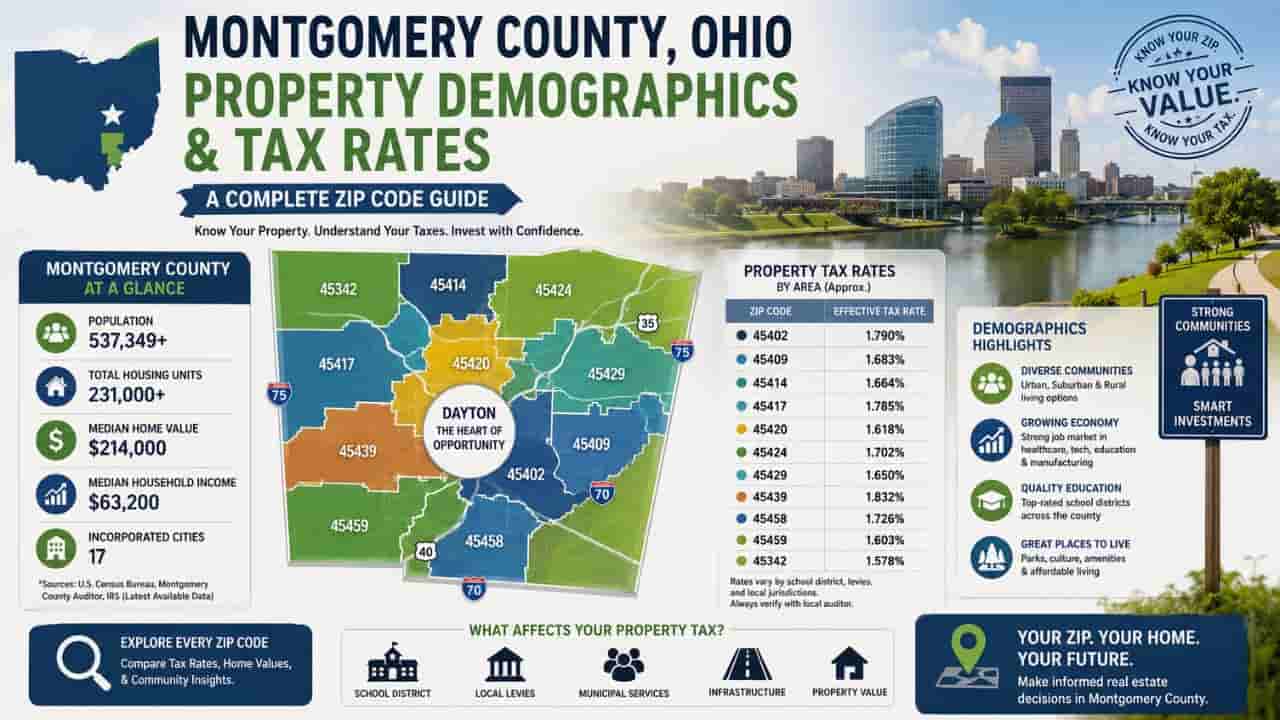
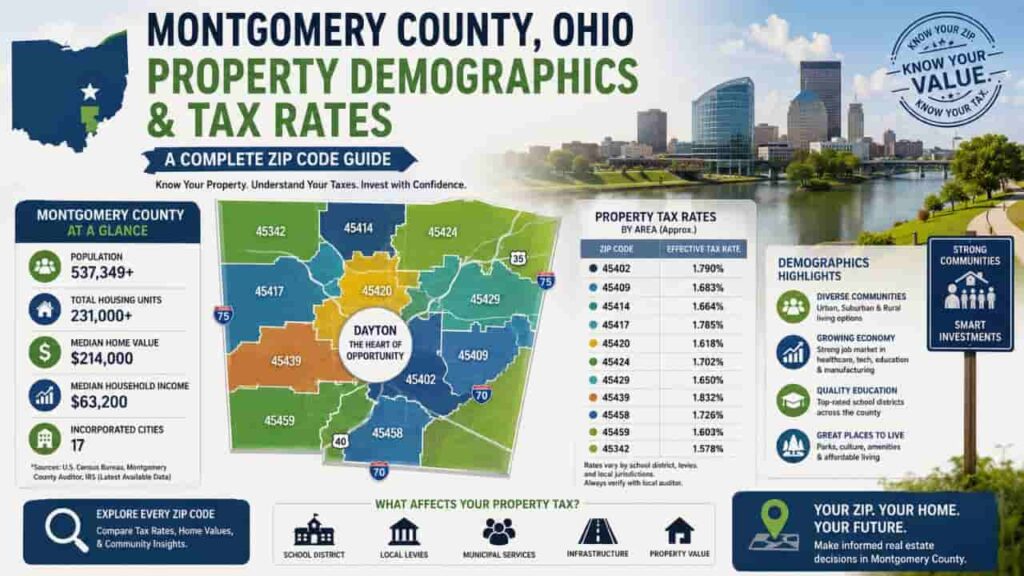
To streamline your property assessment process and eliminate administrative confusion, the three column analytical index below compiles the essential geographic, administrative, and financial benchmarks across every single zip code recognized within Montgomery County, Ohio. These figures represent the verified median effective tax rates and primary educational networks driving local parcel profiles.
Montgomery County Zip Code & Tax Rate Finder
Type your Zip Code or City name below to instantly view school districts and effective tax rates.
| Targeted Property Zip Code | Corresponding City / Township Node | Primary School District & Effective Tax Rate |
|---|---|---|
| 45424 | Huber Heights | Huber Heights City School District (1.98% Effective Rate) |
| 45342 | Miamisburg | Miamisburg City School District (2.30% Effective Rate) |
| 45458 | Centerville / Washington Twp | Centerville City School District (2.12% Effective Rate) |
| 45429 | Kettering | Kettering City School District (2.05% Effective Rate) |
| 45459 | Centerville | Centerville City School District (2.12% Effective Rate) |
| 45417 | Dayton (West) | Dayton City School District (2.16% Effective Rate) |
| 45431 | Dayton / Riverside | Mad River Local School District (2.21% Effective Rate) |
| 45420 | Dayton (East) / Belmont | Dayton City School District (2.16% Effective Rate) |
| 45440 | Kettering / Beavercreek | Kettering City School District (2.05% Effective Rate) |
| 45414 | Dayton / Northridge | Northridge Local School District (2.34% Effective Rate) |
| 45406 | Dayton (Northwest) | Dayton City School District (2.16% Effective Rate) |
| 45405 | Dayton / Harrison Twp | Dayton City School District (2.16% Effective Rate) |
| 45449 | West Carrollton | West Carrollton City School District (2.28% Effective Rate) |
| 45322 | Clayton / Englewood | Northmont City School District (2.19% Effective Rate) |
| 45410 | Dayton (Walnut Hills) | Dayton City School District (2.16% Effective Rate) |
| 45419 | Oakwood | Oakwood City School District (2.61% Effective Rate) |
| 45426 | Trotwood | Trotwood-Madison City School District (2.45% Effective Rate) |
| 45409 | Dayton / University of Dayton | Dayton City School District (2.16% Effective Rate) |
| 45403 | Dayton / Riverside | Dayton City School District (2.16% Effective Rate) |
| 45432 | Dayton / Riverside | Beavercreek/Mad River Districts (2.18% Average Rate) |
| 45377 | Vandalia | Vandalia-Butler City School District (2.26% Effective Rate) |
| 45309 | Brookville | Brookville Local School District (1.89% Effective Rate) |
| 45415 | Dayton / Harrison Twp | Northmont City School District (2.19% Effective Rate) |
| 45404 | Dayton (Old North Dayton) | Dayton City School District (2.16% Effective Rate) |
| 45402 | Dayton (Downtown Core) | Dayton City School District (2.16% Effective Rate) |
| 45439 | Moraine / West Carrollton | West Carrollton City School District (2.28% Effective Rate) |
| 45327 | Germantown | Valley View Local School District (1.85% Effective Rate) |
| 45315 | Phillipsburg | Northmont City School District (2.19% Effective Rate) |
| 45416 | Dayton (North) | Dayton City School District (2.16% Effective Rate) |
| 45345 | New Lebanon | New Lebanon Local School District (1.92% Effective Rate) |
| 45427 | Dayton / Jefferson Twp | Jefferson Township Local School District (2.38% Effective Rate) |
| 45408 | Dayton (Central West) | Dayton City School District (2.16% Effective Rate) |
| 45325 | Farmersville | Valley View Local School District (1.85% Effective Rate) |
| 45418 | Dayton (Southwest) | Dayton City School District (2.16% Effective Rate) |
| 45428 | Dayton (West Corridor) | Dayton City School District (2.16% Effective Rate) |
| 45454 | Dayton (Po Box / Gov Core) | Dayton City School District (2.16% Effective Rate) |
| 45463 | Dayton (VA Hospital Node) | Dayton City School District (2.16% Effective Rate) |
| 45400 | Dayton (Central Carrier Route) | Dayton City School District (2.16% Effective Rate) |
| 45378 | Verona | Tri-County North Local School District (1.82% Effective Rate) |
| 45423 | Dayton (Special Business Node) | Dayton City School District (2.16% Effective Rate) |
| 45343 | New Lebanon (Rural Inset) | New Lebanon Local School District (1.92% Effective Rate) |
| 45354 | Port William (County Edge) | Local Boundary Consolidated District (1.95% Effective Rate) |
| 45401 | Dayton (General PO Box Hub) | Dayton City School District (2.16% Effective Rate) |
| 45412 | Dayton (Commercial Distribution) | Dayton City School District (2.16% Effective Rate) |
| 45413 | Dayton (Industrial Distribution) | Dayton City School District (2.16% Effective Rate) |
| 45422 | Dayton (Municipal Court Inset) | Dayton City School District (2.16% Effective Rate) |
| 45437 | Dayton (Wright State Target) | Fairborn/Mad River Consolidated (2.20% Effective Rate) |
| 45448 | Dayton (Carrier Annex Inset) | Dayton City School District (2.16% Effective Rate) |
| 45441 | Dayton (Special Delivery Sector) | Dayton City School District (2.16% Effective Rate) |
| 45469 | Dayton (UD Campus Academic) | Dayton City School District (2.16% Effective Rate) |
| 45475 | Dayton (Corporate Service Hub) | Centerville City School District (2.12% Effective Rate) |
| 45470 | Dayton (Federal Logistics Box) | Dayton City School District (2.16% Effective Rate) |
| 45479 | Dayton (KeyBank / Corporate Node) | Dayton City School District (2.16% Effective Rate) |
| 45490 | Dayton International Airport | Vandalia-Butler City School District (2.26% Effective Rate) |
Deep Dive Micro Market Profiles of Main Montgomery County Cities
To build a truly profitable investment blueprint, an asset manager must move past the unified county metrics and examine the distinct operational identities of Montgomery County’s primary economic hubs. Each city features unique structural layers, differing tenant populations, and completely independent economic drivers.
1. Dayton (Core Urban Node & Economic Engine)
As the primary economic and historical anchor of Southwest Ohio, the city of Dayton represents a classic industrial urban ecosystem undergoing a modern technology driven revitalization. Spanning core zip codes like 45402, 45410, and 45420, Dayton features a wide architectural spread, ranging from century old historic brick structures in the Oregon District to dense multi family apartment communities and revitalized commercial spaces downtown.
From a property demographics standpoint, the urban core boasts an incredibly accessible entry point for capital. The price to rent ratios remain highly favorable for cash flow focused real estate syndicates specializing in Section 8 housing portfolios and workforce value add property acquisitions. The Dayton City School District maintains a relatively stable effective tax footprint of approximately 2.16%. This predictable rate allows investors to accurately estimate long term underwriting variables while funding urban redevelopment projects.
Furthermore, the city’s positioning alongside major regional healthcare networks and the University of Dayton ensures a consistent, recurring pool of tenant demand for residential properties located near the central core.
2. Centerville / Washington Township (Affluent Suburban Enclave)
Positioned securely in the southern tier of Montgomery County across zip codes 45458 and 45459, Centerville is widely recognized as the county’s premium suburban residential oasis. The demographic profile here is defined by high median household incomes, low vacancy rates, and master planned subdivisions featuring large single family homes, pristine landscaping, and low property turnover.
The primary catalyst behind Centerville’s premium real estate values is the stellar academic ranking of the Centerville City School District. Families willingly pay a substantial premium to secure residential entry into this school boundary, which creates an insulated real estate environment that historically resists wider economic downturns.
While the effective property tax rate stands at 2.12%, the underlying market values of the real estate are significantly higher than the county average. For private equity investors and home buyers prioritizing long term equity appreciation, structural stability, and an affluent tenant base over raw immediate yields, Centerville stands out as an elite choice.
3. Kettering (Balanced Mid Tier Residential Haven)
Kettering functions as the ultimate suburban bridge within Montgomery County, effortlessly balancing middle income residential neighborhoods with extensive industrial and corporate business commerce. Covering key zip codes like 45419, 45429, and 45440, Kettering’s housing inventory consists heavily of mid century single family ranch homes, clean duplex layouts, and highly stable multi family rental complexes.
The city’s property demographics are incredibly resilient, supported by top tier community municipal amenities, an extensive public park network, and a highly responsive city infrastructure. The Kettering City School District offers a highly competitive effective tax rate of roughly 2.05%, which remains a major selling point for budget conscious families seeking exceptional public education without taking on the extreme tax burdens found in neighboring communities.
For institutional buyers and mid market real estate flippers, Kettering offers a low volatility environment characterized by reliable asset liquidity, steady organic appreciation, and consistent, long term tenant retention rates.
4. Huber Heights (Booming Logistics Corridor & Workforce Housing Oasis)
Donating the northeastern corner of Montgomery County within the 45424 zip code, Huber Heights holds a unique title as one of the largest communities of brick ranch homes in the entire nation. Over the past decade, however, the city has transformed from a quiet residential bedroom community into a massive economic logistics powerhouse. Due to its strategic positioning directly along the vital crossroad of the Interstate 70 and Interstate 75 shipping corridors, major global distribution centers, automated manufacturing firms, and logistics corporations have established massive facilities here.
This dramatic influx of commercial capital has created a surging demand for affordable, high quality workforce housing. Real estate investors target Huber Heights because the local housing stock is uniform, easily scalable, and highly attractive to stable working class tenants.
With a highly competitive effective tax rate of 1.98% managed under the Huber Heights City School District, this market offers an exceptional sweet spot allowing property owners to secure strong immediate cash on cash returns while benefiting from the ongoing economic development expanding outward from the logistics zone.
Strategic Property Insight and Market Forecast for 2026 and 2027
As the real estate market advances through 2026 and establishes its structural trajectory for the 2027 fiscal cycles, Montgomery County’s real estate landscape is experiencing a clear operational transformation. Mirroring broader macroeconomic trends across the state of Ohio, local home values are sustaining steady upward pressure. This growth is driven primarily by a persistent inventory shortage within the entry level and mid tier single family sectors, as existing homeowners hold onto low interest mortgages and delay listing their properties.
[Regional Tech/Logistics Growth] --------> [Surging Workforce Housing Demand]
                                                       |
                                                       v
[Persistent Inventory Shortages] --------> [Steady Capital Appreciation (2026-2027)]
                                                       |
                                                       v
[Levy Votes & Auditor Reappraisals] -----> [Critical Need for Dynamic Underwriting]
A major catalyst driving the 2026 and 2027 local economic engine is the massive commercial development expanding outward from the Dayton International Airport hub. The continuous creation of high tech manufacturing positions and advanced e-commerce fulfillment hubs is drawing a steady stream of out of state professionals and regional workers into northern sub markets like Huber Heights, Vandalia, and Clayton. This steady population influx is creating a highly competitive landscape for local multi family assets and single family rental inventories.
For the 2026 and 2027 horizon, expect secondary suburban sub markets such as Miamisburg, Brookville, and West Carrollton to experience the highest rates of capital appreciation. This shift occurs as local home buyers and yield seeking real estate syndicates actively search for alternative investment opportunities to bypass the premium pricing baselines found in Centerville and Oakwood.
Furthermore, sophisticated real estate investors must remain highly vigilant regarding upcoming local school board levy votes and the next scheduled structural adjustments from the County Auditor. Because school districts can legally place new operational funding levies on local ballots during election cycles, a sudden approved levy can shift a zip code’s effective tax rate almost overnight. Incorporating flexible tax margins into your cash flow models and utilizing the county auditor interactive zoning map to identify upcoming residential transition zones will be paramount to safeguarding your net operating income across Southwest Ohio.
Conclusion
Analyzing Montgomery County Ohio property demographics reveals a complex, profitable real estate network shaped by local school tax frameworks. By utilizing this comprehensive zip code matrix and mapping out localized micro markets, you can identify high yield pockets while avoiding unexpected tax liabilities. Rely on these verified public records to protect your assets, optimize your escrow projections, and maximize your investment returns across Southwest Ohio.
FAQs
Which zip code has the highest property tax rate in Montgomery County?
The city of Oakwood (Zip 45419) carries the highest effective property tax rate in the county, driven by its premium municipal and public school funding levies.
Why do property tax rates vary so much within the same county?
Property tax rates vary because each specific township, municipality, and public school district approves separate funding levies tailored to their independent local budget requirements.
What is the real estate market outlook for Dayton in 2026 and 2027?
The outlook remains highly competitive, with steady price growth projected due to strong regional employment expansion and a continuing shortage of single family housing stock.
How often does the Montgomery County Auditor update property values?
In accordance with Ohio law, the Auditor executes a full structural property reappraisal every six years, with an additional statistical triennial update calculated at the three year midpoint.
Do higher school district tax rates lower overall property values?
Not necessarily. While higher tax millage increases monthly payments, premium school districts like Centerville and Oakwood continuously attract high buyer demand, keeping home values exceptionally strong.