In the modern real estate landscape of Montgomery County, Ohio, data is no longer just flat text it is spatial. The Montgomery County GIS (Geographic Information System) serves as the county’s digital nervous system, maintained under the strict oversight of the Montgomery County Auditor. While the Auditor’s primary mandate is property valuation, it is their specific responsibility to manage these interactive maps to ensure every parcel boundary, tax line, and zoning district is geographically accurate. As a spatial data expert, I have used these mapping systems to resolve boundary disputes and analyze urban development. This guide will transform you from a basic user into a GIS power user, providing the step by step clarity needed to unlock official land data.
Why Use the Montgomery County GIS Instead of Standard Maps?
Standard GPS apps like Google Maps are built for routing, not for legal land analysis. The Montgomery County GIS portal offers “High Resolution Spatial Accuracy” that professional surveyors, engineers, and real estate attorneys rely on.
Core Benefits of Official GIS Mapping.
- Precise Property Lines. See exactly where one yard ends and another begins.
- Topography Layers. Analyze the elevation and slope of the land to check for drainage or flood risks.
- Historical Overlays. Compare current satellite imagery with aerial photos from decades ago to track property changes.
- Zoning & School Districts. Verify the exact legal boundaries for school enrollment or commercial business permits.
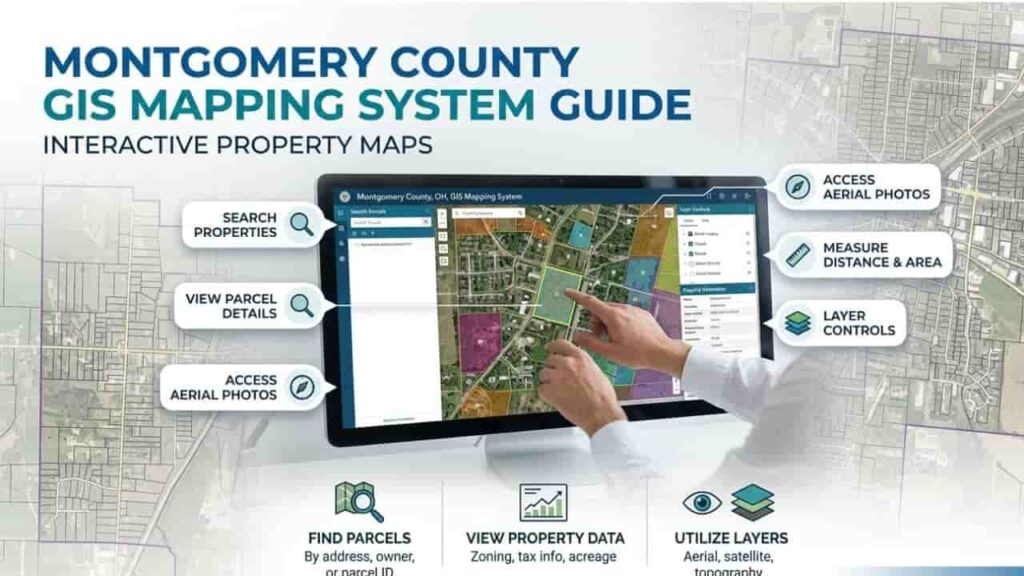
Step by Step, Using the Montgomery County GIS Portal
The mapping interface can be intimidating at first. Follow these professional steps to find the data you need efficiently.
Step 1. Access the Interactive Map
Go to the official Montgomery County Auditor’s GIS page. Ensure you are using a desktop browser for the best experience, as the high detail layers can be heavy for mobile devices.
Step 2. Locating Your Target Parcel
You don’t need to scroll endlessly. Use the “Search” bar at the top left. You can search by.
- Parcel ID. The most accurate way to “zoom” directly to a specific property.
- Owner Name. Type the last name followed by the first initial.
- Address. Enter the street number and name without abbreviations.
Step 3. Managing Information Layers
The real power of GIS lies in the Layer List. Think of these as transparent sheets stacked on top of each other.
- Aerial Imagery. Toggle this for a real world view of the structures.
- Lot Dimensions. Enable this to see the length and width of the property lines in feet.
- Contour Lines. Essential for checking the “lay of the land” and potential basement flooding issues.
The Technical Infrastructure of Montgomery GIS Data
Understanding the data types within the system helps you interpret what you are seeing on your screen.
| Layer Category | Data Type | Common Use Case |
| Cadastral | Parcel Boundaries | Identifying legal land limits and easements. |
| Environmental | Floodplains & Soil | Checking FEMA flood zones before purchasing. |
| Jurisdictional | Taxing Districts | Verifying which city or township collects the tax. |
| Planning | Future Land Use | Seeing if a new highway or commercial park is planned nearby. |
Environmental and Government Use of GIS Mapping
The Montgomery County Auditor uses these maps for more than just looking at houses. Government agencies use this spatial data for.
- Emergency Response. Helping 911 dispatchers find the exact location of a remote rural property.
- Tax Assessments. Using aerial photography to spot new decks or pools that weren’t reported via permits.
- Public Works. Mapping out water lines, sewer systems, and road maintenance schedules.
Common Problems & Professional Solutions
The “Boundary Shift” Misconception
Sometimes, the digital parcel line on the GIS map looks like it goes through a neighbor’s house or a fence. Expert Tip, GIS maps are “representative” for tax purposes. They are not a legal survey. If you need a precision boundary for a fence installation, always hire a licensed land surveyor.
Slow Loading Layers
If the map is laggy, turn off the “Aerial Imagery” layer and use the “Line Map” only. This reduces the data load on your browser significantly.
Expert Conclusion for Landowners
The Montgomery County GIS Mapping System is an indispensable asset for anyone involved with real estate in Ohio. By understanding how to toggle layers and interpret spatial data, you move beyond simple searches and into deep property analysis. Whether you are checking for utility easements or verifying a lot size before an upgrade, this tool provides the official transparency you need to make informed decisions. Don’t just look at the record card look at the land. Use the GIS portal to see the full story behind every property in the county.
FAQs
Is the Montgomery County GIS map updated in real time?
No. While the Auditor updates parcel information nightly, the visual map layers (like aerial photography) are typically refreshed every 1 to 3 years through countywide flyovers.
Can I measure the acreage of a property on the map?
Yes. Use the “Measure Tool” in the GIS toolbar. You can draw a shape around any area to get an approximate square footage or acreage instantly.
How do I find the flood zone for a Montgomery County property?
Open the Layer List and search for “FEMA Flood Hazards.” Turning this on will highlight areas at risk of 100 year or 500 year floods in blue or red.
Can I print a map for a legal meeting?
Yes. There is a “Print” or “Export” function that creates a high quality PDF. Professional tip. Ensure you include the “Scale Bar” and “North Arrow” so the map is readable for others.
Who is responsible for correcting GIS errors?
If you notice a major discrepancy in your parcel shape, you must contact the Montgomery County Auditor’s GIS Department. They are the sole authority for correcting spatial tax data.